
Commercial Property ROI Calculator
Calculate Your Investment Returns
Input your property details to see your projected returns compared to industry benchmarks.
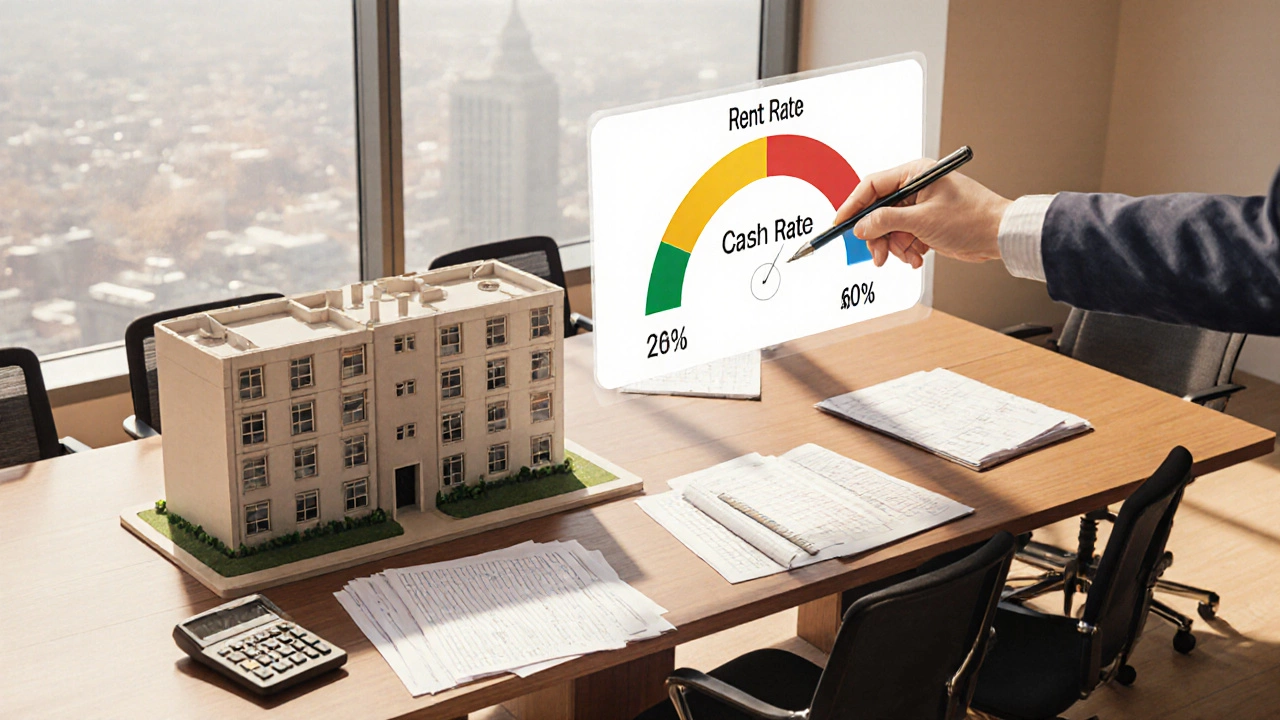
Cap Rate
Cash-on-Cash Return
Investment Recommendation
When investors ask, “what’s a good return on investment for commercial property?” they’re really looking for a number that tells them the deal makes sense compared with other opportunities. The short answer is that a solid good return on investment for commercial property usually sits between 6% and 12% cash‑on‑cash, with cap rates ranging from 5% to 9% depending on location, asset class, and market conditions.
Key Takeaways
- Cash‑on‑cash returns of 6%-12% are generally attractive in 2025.
- Cap rates between 5% and 9% reflect healthy risk‑adjusted yields for most Australian markets.
- Calculate ROI using Net Operating Income (NOI), purchase price, financing costs, and tax impacts.
- Location, tenant quality, lease terms, and operating expenses are the biggest ROI drivers.
- Use a simple checklist to vet any commercial property before committing capital.
Understanding ROI Basics
Return on Investment (ROI) measures the profit you earn relative to the money you put in. In commercial real estate the term covers several related metrics:
Net operating income (NOI) is the property’s income after operating expenses but before financing and taxes.
Capitalization rate (cap rate) equals NOI divided by the purchase price, giving a quick yield snapshot.
Cash‑on‑cash return measures cash profit versus cash invested, factoring in loan payments.
These three numbers let you compare properties of different sizes, financing structures, and markets on an apples‑to‑apples basis.
How to Calculate Commercial Property ROI
- Gather Income Data: Add up all rent, service charges, and ancillary income. For a 10‑unit office building in Adelaide, that might be AUD 1.2million per year.
- Subtract Operating Expenses: Include property management, insurance, repairs, utilities, and vacancy loss. Suppose expenses total AUD 400,000, leaving an NOI of AUD 800,000.
- Compute Cap Rate: Divide NOI by the acquisition price. If the building cost AUD 12million, the cap rate is 800,000 ÷ 12,000,000 = 6.7%.
- Factor in Financing: Determine annual debt service (loan repayments). A 70% loan at 5% interest over 25 years would cost about AUD 540,000 per year.
- Calculate Cash‑on‑Cash: Cash profit = NOI - debt service = 800,000 - 540,000 = AUD 260,000. Cash invested = down‑payment + closing costs ≈ AUD 3.6million + AUD 150,000 = AUD 3.75million. Cash‑on‑cash = 260,000 ÷ 3,750,000 ≈ 6.9%.
- Adjust for Taxes & Depreciation: Include tax shields from depreciation (e.g., 2.5% of building value per year) and any capital gains tax implications.
These steps give you a realistic picture of what you’ll earn after paying the bank and handling day‑to‑day costs.
Typical ROI Ranges by Property Type
| Property Type | Cap Rate | Cash‑on‑Cash Return | Key Risk Drivers |
|---|---|---|---|
| Office | 5.5% - 7.5% | 5% - 9% | Remote‑work trends, lease‑up speed |
| Retail (high‑street) | 6% - 8% | 6% - 10% | Consumer spending, anchor tenant stability |
| Industrial/Warehouse | 6.5% - 9% | 7% - 12% | Supply‑chain shifts, zoning changes |
| Mixed‑Use (ground‑floor retail + upper‑floor office) | 5% - 7% | 5% - 9% | Complex lease structures, management intensity |
| Special Purpose (healthcare, data centres) | 7% - 10% | 8% - 13% | Regulatory approvals, high build‑out costs |
These figures come from recent transactions in Sydney, Melbourne, Brisbane, and Adelaide. They reflect a post‑COVID market where demand for logistics space is strong, office demand is stabilising, and retail is rebounding in prime locations.
Factors That Influence ROI
Every metric in the table can swing dramatically based on a handful of variables:
- Location quality: Proximity to transport hubs, population growth, and local employment rates.
- Tenant creditworthiness: Longer leases with blue‑chip tenants lower vacancy risk.
- Lease terms: Rent‑free periods, escalation clauses, and renewal options affect cash flow.
- Operating expense control: Energy efficiency, preventative maintenance, and property management fees.
- Interest‑rate environment: Higher rates increase debt service, pulling down cash‑on‑cash.
- Market cycle: Buying at the peak squeezes cap rates, while buying in a trough can lock in upside.
How to Evaluate a Specific Deal - A Quick Checklist
- Confirm the advertised NOI with a rent roll and expense ledger.
- Run the cap‑rate calculation and compare it to the type‑specific benchmark.
- Model financing scenarios (different loan‑to‑value ratios, interest rates, amortisations).
- Run a cash‑flow projection for at least five years, including expected rent escalations.
- Stress‑test the model: increase vacancy by 2‑3%, raise operating costs by 10%.
- Check tenant leases for break clauses, rent‑free periods, and expiry dates.
- Verify zoning, development approvals, and any upcoming capital works.
- Assess tax implications: depreciation schedules, GST treatment, and potential CGT.
- Conclude with a decision matrix - “Buy”, “Negotiate”, or “Walk away”.
Following this list keeps you from overlooking hidden costs that could turn a 7% cash‑on‑cash into a 4% disappointment.
Common Pitfalls & Pro Tips
- Pitfall: Relying solely on advertised cap rate. Tip: Re‑calculate using your own verified NOI.
- Pitfall: Ignoring future capital expenditures. Tip: Set aside 1%-2% of the property value annually for replacements.
- Pitfall: Over‑leveraging to boost cash‑on‑cash. Tip: Keep loan‑to‑value below 70% to maintain flexibility if rates rise.
- Pitfall: Assuming market rents will stay flat. Tip: Research local rent growth trends - most Aussie cities have seen 2%‑3% annual growth.
- Pitfall: Forgetting tax benefits. Tip: Use a qualified accountant to maximise depreciation and negative‑gearing effects.
Frequently Asked Questions
What is a healthy cap rate for an office building in Adelaide?
In 2025 Adelaide office cap rates typically sit between 5.5% and 7%. Anything above 7% may signal higher vacancy risk or a less‑desirable location.
How does cash‑on‑cash differ from cap rate?
Cap rate ignores financing and taxes; it’s a pure property‑yield metric. Cash‑on‑cash factors in the actual cash you invest and the loan payments you must make, giving a more realistic picture of immediate return.
Can I achieve a 10% cash‑on‑cash return on industrial assets?
Yes, especially in high‑growth logistics corridors where cap rates can exceed 8% and tenants sign long‑term triple‑net leases that keep operating expenses low.
How do interest rate changes affect my ROI?
Higher rates increase debt service, which lowers cash‑on‑cash. They also push cap rates up, reducing property values and potentially creating buying opportunities for savvy investors.
Should I focus on gross rental yield or net operating income?
Net operating income is the more reliable metric because it accounts for the real costs you’ll incur. Gross yield can be misleading if a property has high expenses.
Understanding what counts as a good ROI lets you spot deals that truly add value to your portfolio. Use the formulas, benchmarks, and checklists above, and you’ll be able to separate the winners from the noise.